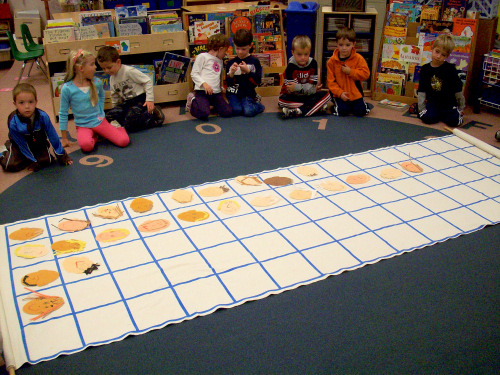
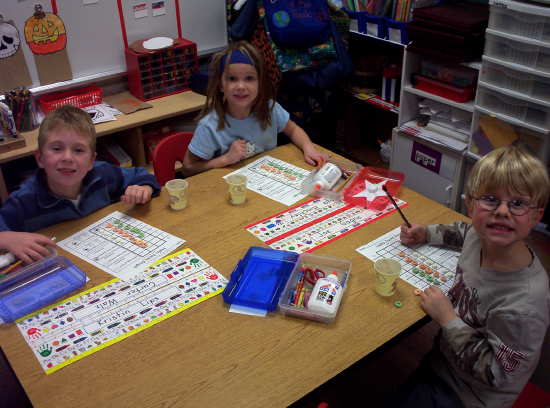
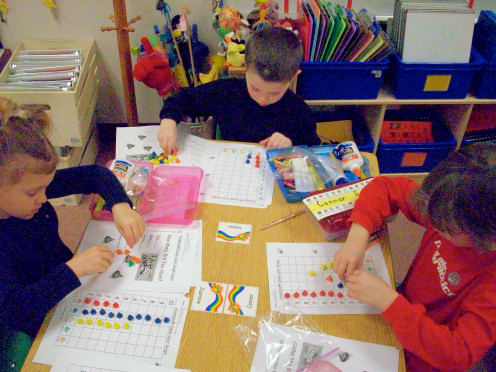
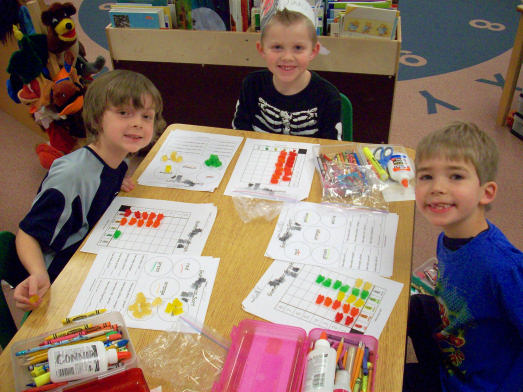
Graphing(Click on any image to see a larger version of that image.) Graphing is a very important math skill that we do a lot in my classroom. Most of the graphs we do relate to the theme of the day. I use the floor graph a lot. The floor graph is the easiest because there is not prep work involved. Sometimes, after graphing first on the floor graph, we put the objects on a paper graph for display. My floor graph was purchased many years ago from the Center for Innovation in Education. I do not think it is available anymore. You can easily make your own using a flannel backed plastic tablecloth or a shower curtain. You can put the lines on with permanent marker or tape. Blair Felgar from NH emailed me that she found another floor graph. They are available from www.etacuisenaire.com. Just type graphs into their search feature. There are some very good books out there to help you get some ideas for graphs. I love the new book Gotta Have Graphs! from The Education Center. It also contains many glyph ideas.
There were many different graphs we did during our "Apple Week." The first one we did was graphing our favorite way to eat apples. I had clip art of apple pie, whole apple, apple juice and applesauce. The kids had to place an apple cut out in the column of their favorite.
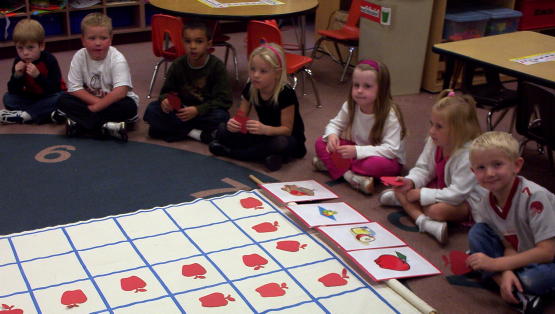
Click here for the Apple Graph PDF.
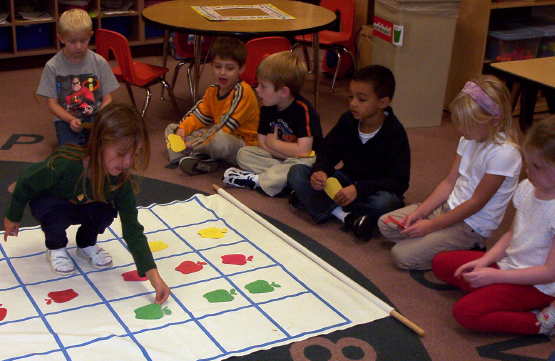
Favorite Kind of Apple - We also graphed our favorite kind of apple during "Apple Week." I found out it was very important to give the children an opportunity to taste all 3 colors of apples. Each child tasted Granny Smith, Red Delicious and Golden Delicious. Some of the students were pleasantly surprised to find that they liked apples. We used the floor graph and the kids placed a cut out that was the color that they liked the best on the graph.
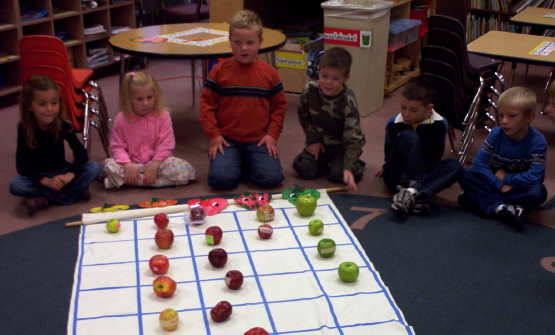
Color of Apple Graph - The kids had to bring in an apple that we used to make applesauce. Before we made the applesauce, we graphed what color their apples were. We had red, yellow, green, red/green and red/yellow. I had pictures of the different collors on the end of the floor graph and the kids had to place their apple on the graph.
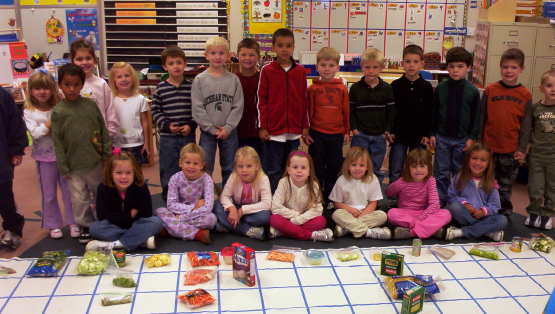
Stone Soup Graph - Each child had to bring in an ingredient to add to our "Stone Soup." We graphed the ingredients by placing them on the floor graph. Because we had so many ingredients, we had to graph horizontally.
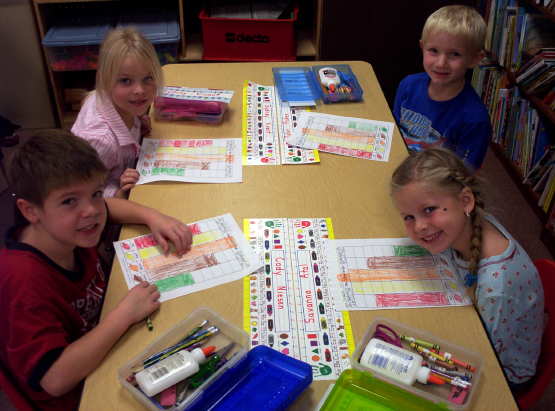
Leaf Color Graph - To make this graph, I gave each child 2 die cut leaves in different fall colors. The leaves are laminated and I use them over and over again. The children had to place their leaves on the floor graph in the correct column.
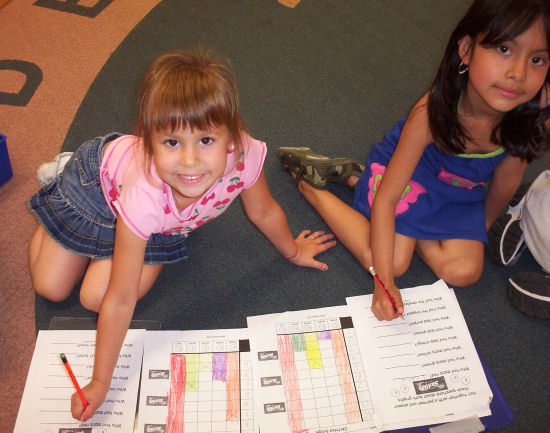
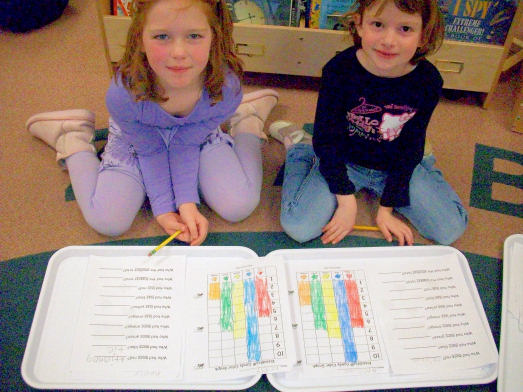
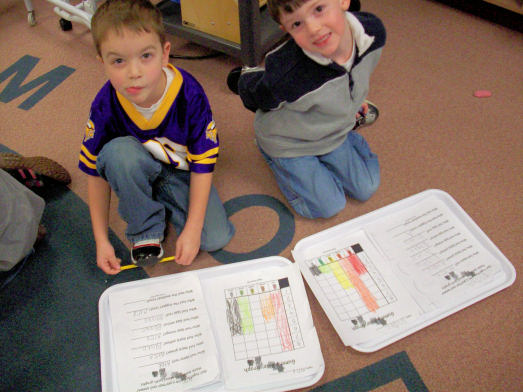
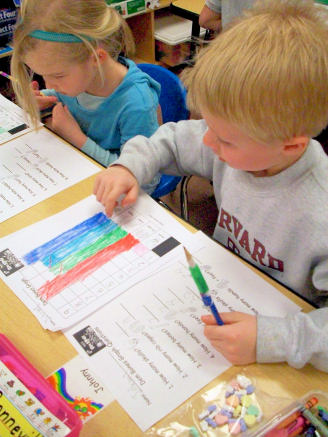
 Click here for Leaf Color bar graph and analysis questions. Leaf Color Bar Graph - After completing the floor graph of leaf color, we left the floor graph on the floor. We then transferred our floor graph results to individual graphing sheets.
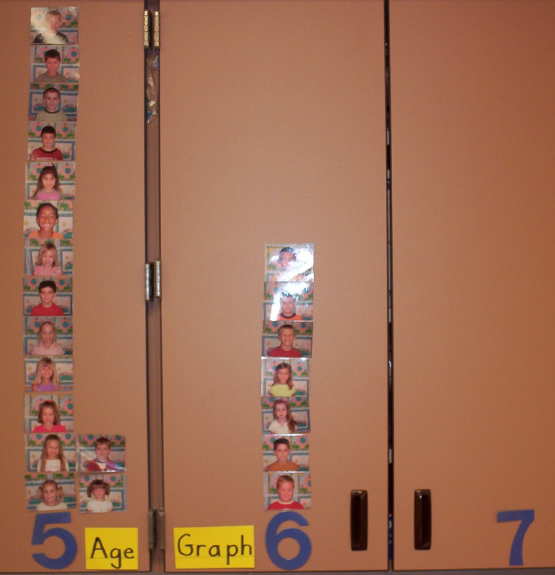
Age Graph - We have an ongoing age graph up in our classroom all year long. As the children celebrate a birthday, we move their picture to the next column.
Teddy Graham Graph - The kids also graphed the Teddy Grahams that got in a cup. They had to graph them by whether the bear's arms were up or down. First they placed them on the graph blackline. They removed the bears and colored in their graph to show the correct amount. There are never many bears with their arm's up.
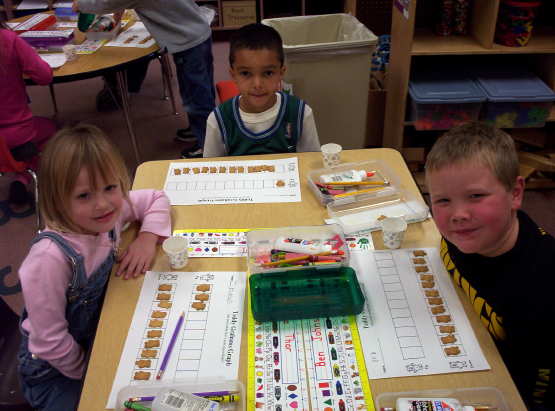
I found there were not many bears with their hands up so I switched to graphing the flavors of Teddy Grahams. Click here for PDF of Teddy Grahams Flavor Graph. (Enlarge on copy machine to legal size.) Click here for PDF of Teddy Grahams Graph questions.
Trix Tallies - It's not really graphing, but we sorted Trix cereal by color. The kids had to then count the Trix of each color and make that many tallies. This was a VERY difficult activity for November. I would do it in small groups or with a parent volunteer next time. I also would not give the kids as many Trix in their cups.
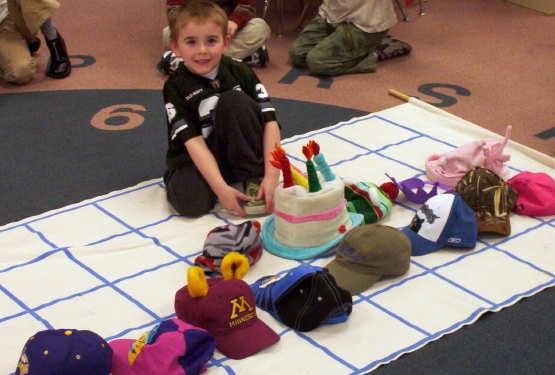
Hat Graph - On "Hat Day," the kids had to wear a hat. We used the floor graph to graph how many were baseball type hats and how many were not baseball type hats.
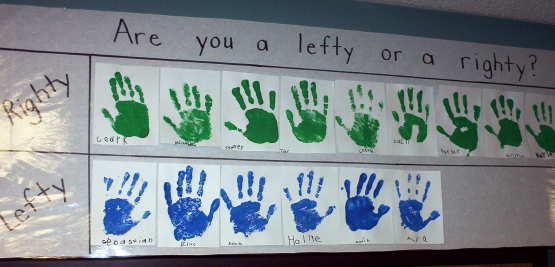
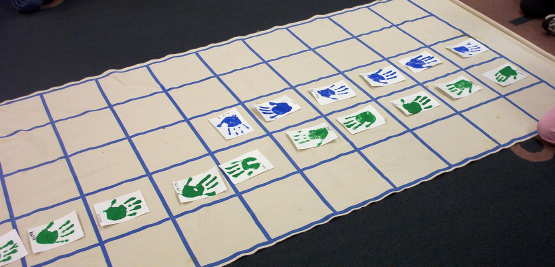
Left or Right Handed Graph - To make this graph, the kids hand to make a hand print of their left or right hand, whichever one they write with. I had them write their name first and that is how I know which hand to paint. Use 2 different colors of paint, one for right, a different color for left. After the prints had dried, we place them on the floor graph. I then transferred the hands to a paper graph so I could put it out in the hall. I thought the results were very interesting, 6 lefties!!
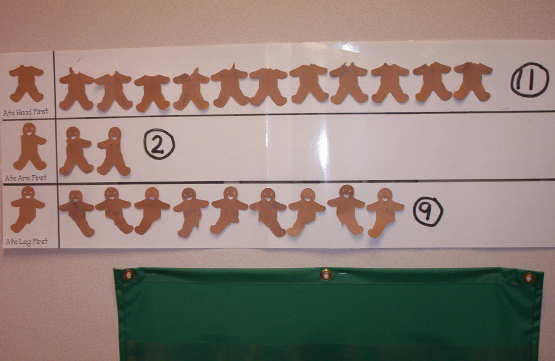
Gingerbread Man Graph - After looking for the Gingerbread Man, we got a gingerbread cookie. I had the kids take one bite of the cookie and then tear off what body part they ate first.
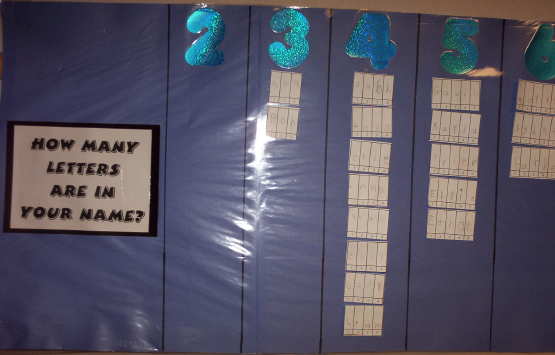
Letters in Name Graph - To make this graph the kids had to write their name on graph paper, one letter in a square. This year I used this grid which had numbers below each rectangle to show how many letters were used. We placed the strips on this paper graph. The graph goes up to 10+ letters.
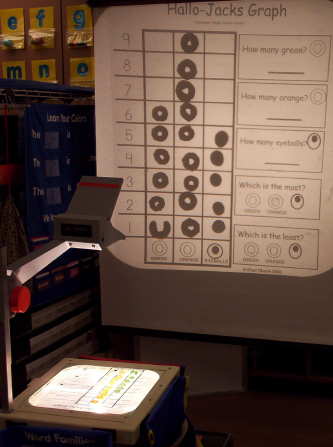
Halloween Apple Jacks Graph - I created a graph to graph the Halloween version of Apples Jacks. They graph the green, orange and eyeball marshmallows. Click Here for the Halloween Apple Jack Graph.
Halloween Gumdrop Graph - We started real object graphing with the apple seed graph, it was one column. Next I wanted to do a 2 column graph. I chose to do Black and Orange Gumdrops. Click here for the PDF of the gumdrop graph. (It shows the wrong colors , but you run it off in black and white.)
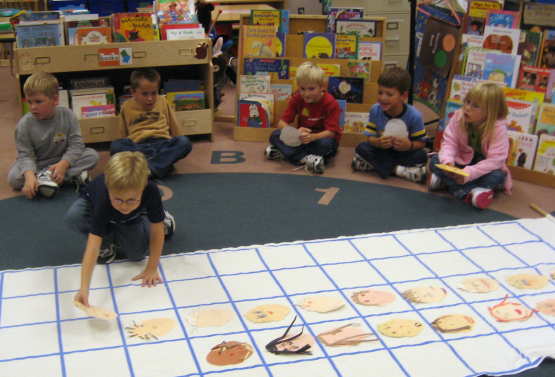
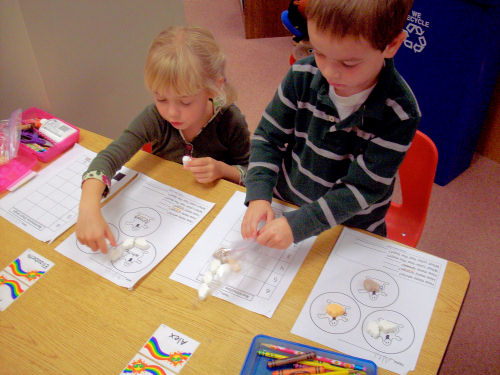
Boys and Girls Graph - Early in the year, we graph how many boys and how many girls are in our class. Each child makes his/her own face using the face shape sheet (or a small paper plate). Each child then lays his/her head on the floor graph. We leave the faces on the floor graph while we transfer the information to an individual bar graph sheet. I have included the PDF for that graph. I made it using clipart from www.djinkers.com. I get many emails asking me where I got the clipart for all of my cute book covers, Writing Office, etc. Almost all of that clipart is from DJInkers. I own many of their clipart CD's. My personal favorites are "Kidillywinks" and "Dazzle Daze." They also have a new one that I just got that is great! We took our face shapes and then made a paper graph to hang up in the hall. I have included the text headings to use to make your graph.
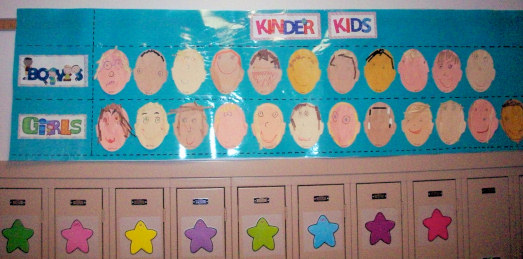 Click Here for Boy Girl Graph PDF
Hair Color Graph - We use the same face shapes, to graph our hair color.
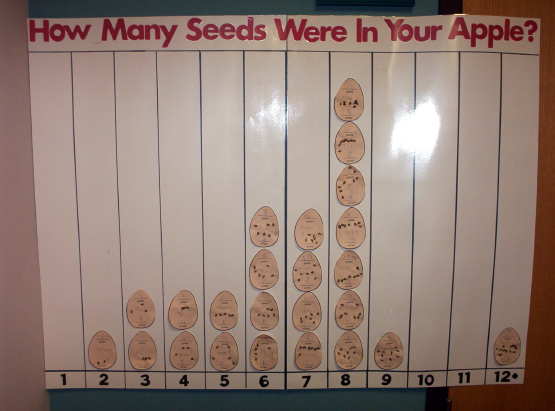
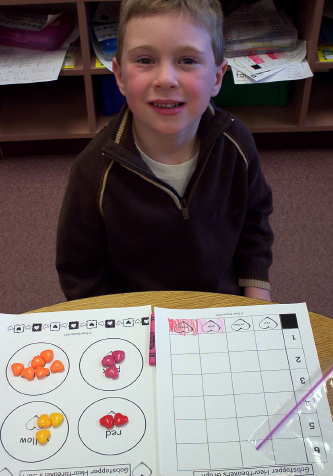
Number of Seeds in Apple - When my students make applesauce, they use the Apple Peeler Corer machine. After a child has peeled and cored his/her apple, he/she guesses how many seeds are in that apple. The child writes that guess on a seed shape and on the graphing sheet. The seeds are then put in a baggie until later. In the afternoon, each child dumps out his/her seeds and places them on the bar graph. The child count the seeds and then writes the number on the graph sheet and the seed shape. Then the child glues his/her seeds on the seed shape. When the glue dries on the seeds, we graph the number of seeds found in each apple. Click Here for PDF of apple seed graph.

Valentine Chocolate Candies Graph - We do this graph with the Valentine color chocolate candies. Click here for the sorting sheet.

Valentine Gobstopper Graph - We did this graph in February. I find seasonal candies like these at a local chain farm supply store called Fleet Farm. Click here for the sorting sheet.
Lucky Charms Graph - For St. Patrick's day we graph "Lucky Charms" Cereal from General Mills. My students are getting to be very good and real object graphing (the substitute teacher was very impressed) so I added more difficult question to interpret the graph. My students now have to add 2 columns to get the total. After attempting this graph with my class I learned some very important things. Fist of all, you need the super size box of Lucky Charms or 2 regular size boxes to get enough marshmallows. I have a class of 24 and with one box most kids did not get enough marshmallows to make a good graph. Either way, the kids have to sort through a lot of cereal to get to the marshmallows. Secondly, make sure your box is not the special kind with the mystery marshmallows. There was no spot for them on the graph. Click Here for Graph Question Sheet.
Spring Colors Chocolate Candies Graph - Stock up on those Spring Colored Chocolate Candies to do this fun real object graph. There are 5 different colors of the spring candies.

Click Here For the Spring Color Compare Questions PDF Click Here for the Spring Candy graph PDF. Click Here for the Sorting and Question Sheet PDF .
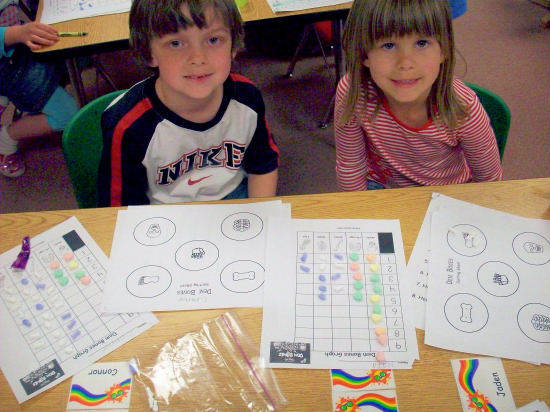
Starburst Jelly Bean Graph - There are so many different kinds of jelly beans with different colors, I decided to make a graph for my favorite kind of jelly beans, Starburst. It is a little more difficult because I wrote the flavors not the colors. I have included 2 graphs, 1 with the numbers and 1 without and a sorting sheet. Click here for the PDF Graph with Numbers. Click here for the PDF Graph without numerals. Click here for sorting and question sheet. Click here for the Starburst Jellybean Comparing Questions PDF.
Marshmallow Bunny Sort and Graph - I love those fun bunny marshmallows that come in 4 fun colors in the spring. My students do, too. With this activity the kids had to sort the bunnies, graph them, answer the questions and compare graphs with a friend.

Click here for Bunny Graph Questions. Click here for partner questions.
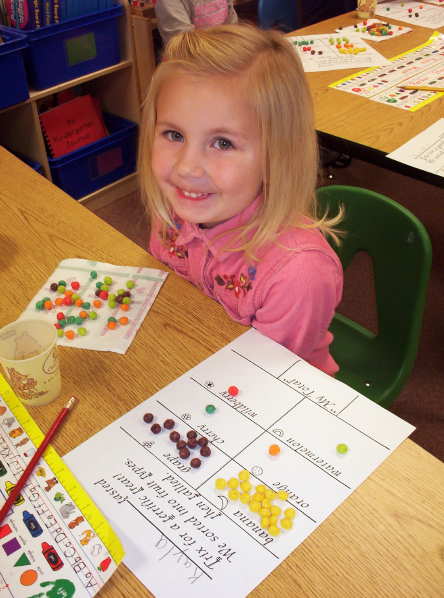
Skittles
Candy Corn Graph - Brachs came out with some new delicious flavors of candy corn this year. I made a graph to go with them. Click here for the candy corn graph. I also created this sheet to have the kids make patterns with regular candy corn. Click Here For Another Candy Corn Graph. Color Goldfish Graph - It is also a lot of fun to graph the different colors of Goldfish Crackers. We read the book Pepperidge Farms Goldfish Counting Fun by Barbara Barbieri McGrath.
Click Here for the Goldfish Graph without Numbers. Click Here for the Goldfish Sorting Sheet. Click Here for the Goldfish Partner Question Sheet.
Halloween Ghost Marshmallow Graph - In 2008, I made a graph to go with Kraft's Jet-Puffed Ghostmallows Marshmallows. It worked well to do 3 colors right after the 2 color gumdrops. The kids had a lot of fun with the cute ghosts.
Click Here For Halloween Ghost Marshmallow Sort Sheet.
In December, the Jet-Puffed HolidayMallows Marshmallows are in stores. Here is the graph to have some delicious graphing fun. Click here for Christmas Marshmallow Graph.
3D Shapes Treats Graph - This is one of the most delicious graphs that we do. It really helps the kids learn their 3D shape names.The spheres are Whoppers, cylinders are licorice, cubes are caramel and cones are Hershey Kisses. Yum! Yum!
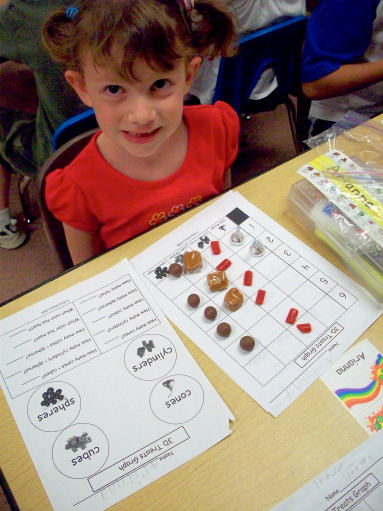
Click Here For the 3D Treats Graph PDF. Click Here For the 3D Treats Sorting PDF. Click Here For the Comparing Question PDF.
3D Snack Graph - My friend Jolene Harms shared this fun 3D snack graph with me. It is another fun way to teach the 3D shapes. Click Here For the 3D Snack Graph.
Eye Color Graph - Using the same face shapes we graph our eye color. I also use laminated color sheets with googly eyes on them to graph eye color on the floor graph. Then we can record the data on the the sheet.

Click Here For the Eye Color Graph.
Kissables Graph - This is a fun graph to do during K week (there doesn't seem to be that much for K). It is delicious and has 5 colors for sorting.
Click Here For the Kissable Graph PDF Click Here For the Kissables Graph Questions PDF Click Here For the Kissables Graph Comparing Questions PDF
Gummy Bear Graph - I made 2 sets of this graph to go with 2 different combinations of colors. The first set is for 6 colored Gummy Bears. The second set is for 5 colored Gummy Bears. Again with this graph, the kids LOVE to do the comparing of graphs with their friends. It really is impressive to watch them use the math language.
Click Here For the Gummy Bear Graph (6 Colors) PDF Click Here For the Gummy Bear Sorting and Questions (6 Colors) PDF Click Here For the Gummy Bear Comparing PDF (6 Colors) Click Here For the Gummy Bear Graph (5 Colors) PDF Click Here For the Gummy Bear Sorting and Questions (5 Colors) PDF Click Here For the Gummy Bear Comparing PDF (5 Colors)
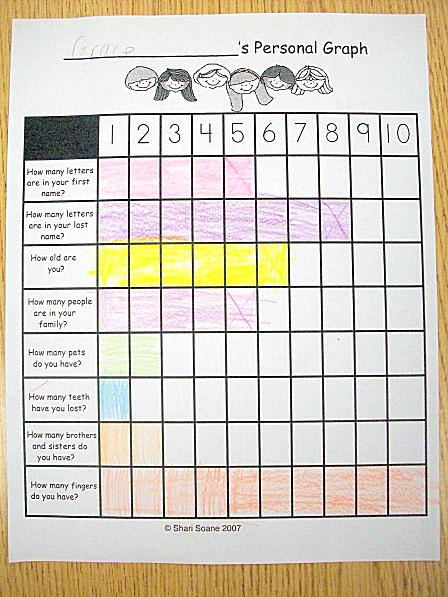
Personal Graph - This is a great graph to do later in the year. A lot of interesting discussions come up:) Click Here For the Personal Graph PDF

Dem Bones Graph - I order these candies from Oriental Trading at Halloween time and then I save them for X Week (X-rays). I found the sorting sheet somewhere on the internet. Click Here For the Dem Bones Graph Click Here For the Dem Bones Question Sheet
Classroom Objects - We also graph things that are in our classroom. Click Here For the Classroom Object Graph PDF
Coin Graph - Graphing coins is a great way to practice coin recognition and graphing. I just have baggies with different combinations of coins and the kids graph them. Click Here For the Coins Graph PDF Click Here For the Coins Compare Graph PDF
Sticker Graph - For this graph I passed out strips of different chart stickers. We did each kind of sticker one at a time.

Click Here For the Sticker Graph PDF Click Here For the Sticker Graph Questions PDF
Transportation Graph - If you teach in school where kids arrive in different ways you can do this "How Did We Get To School" graph. Click Here For the Transportation Graph PDF
Dice Roll Graph - We do this graph as part of our Calendar Book. It makes a great center as well. The kids can roll 2 dice for a certain amount of time and graph the sum of their rolls. They love trying to get 2's and 12's. Click Here For the Dice Roll Graph PDF
|